The mountain air is bracingly cool and the sky is clear as the Mountain Legacy Project’s Julie Fortin peers through the camera. The image she is about to capture is a perfect replicate of one taken 100 years ago from the exact same mountain peak, overlooking the same stretch of southwestern Alberta.
The photo she takes today will soon make its way to Mary Sanseverino and the Mountain Legacy Project (MLP) team in Victoria, BC. There, they are working on a powerful new open-source tool that will allow them to extract unprecedented amounts of information from this photo pair and many more. Their efforts will also make it possible to complement the Fire Regime team’s fire record, providing a more complete picture of the region’s fire history by showing how the landscape looked between fires.
Harnessing photos to travel through time
In collaboration with other Landscapes in Motion teams, MLP’s Visual Applications team developed software for visualizing, classifying, and quantifying landscape change using historical and modern photographs from this study area. The development of software like this unlocks the potential of MLP’s collection of oblique (ground-level) photographs, offering fire science researchers a look at the landscape in the Canadian Rockies as it was photographed by geological surveyors over 100 years ago.
This application—the “Image Analysis Toolkit”—provides an end-to-end process that allows researchers to align historic and modern images, apply landscape classification categories to the images (also known as “masks”), quantify the on-the-ground extent of each class in an image, and more.

On the lower slope of Missing Link Mountain looking westward over Gorge Creek and Sheep River. Modern panoramic image (MLP, 2018) superimposed with historical photos taken by David Nichols in 1916. Historic images courtesy of Library and Archives Canada.
Creating a georeferenced, masked viewshed
The Image Analysis Toolkit includes several new processes for analysing an image, including building a virtual image and creating a georeferenced viewshed. These new processes make it possible to take the pixels from a historical or modern photo and directly connect them with a location and land area (e.g., m²) on the map. It is now possible to calculate land cover types (like coniferous forest) in terms of hectares. Additional steps were also taken to make it possible to calculate more variables like tree height and density categories, as you will see in the example below.
These new techniques make it possible to draw more, and more robust, conclusions about what this landscape looked like 100 years ago.
The South Quirk case study
In developing these new processes, the Visual Applications team analysed 17 historical photographs that overlooked land areas that included the locations of Fire Regime team plots. This step included photographs overlooking the South Quirk area, where they also processed the modern repeat photo. Using the new processes, it became possible to calculate the change in land area not only in terms of percentages, but in terms of actual hectares.

Land cover masks created and applied to an aligned image pair at the South Quirk station. The red and blue shapes indicate plots where the Fire Regime team collected on-the-ground data including tree cores. Image courtesy of the Mountain Legacy Project.

Images taken in 1897 and 2014 were used to produce a viewshed using the Image Analysis Toolkit, which was then overlain on a digital elevation map. The result is a map showing where and how much conifer forest and herbaceous (grassy) areas occurred in the two time periods. Image courtesy of the Mountain Legacy Project.
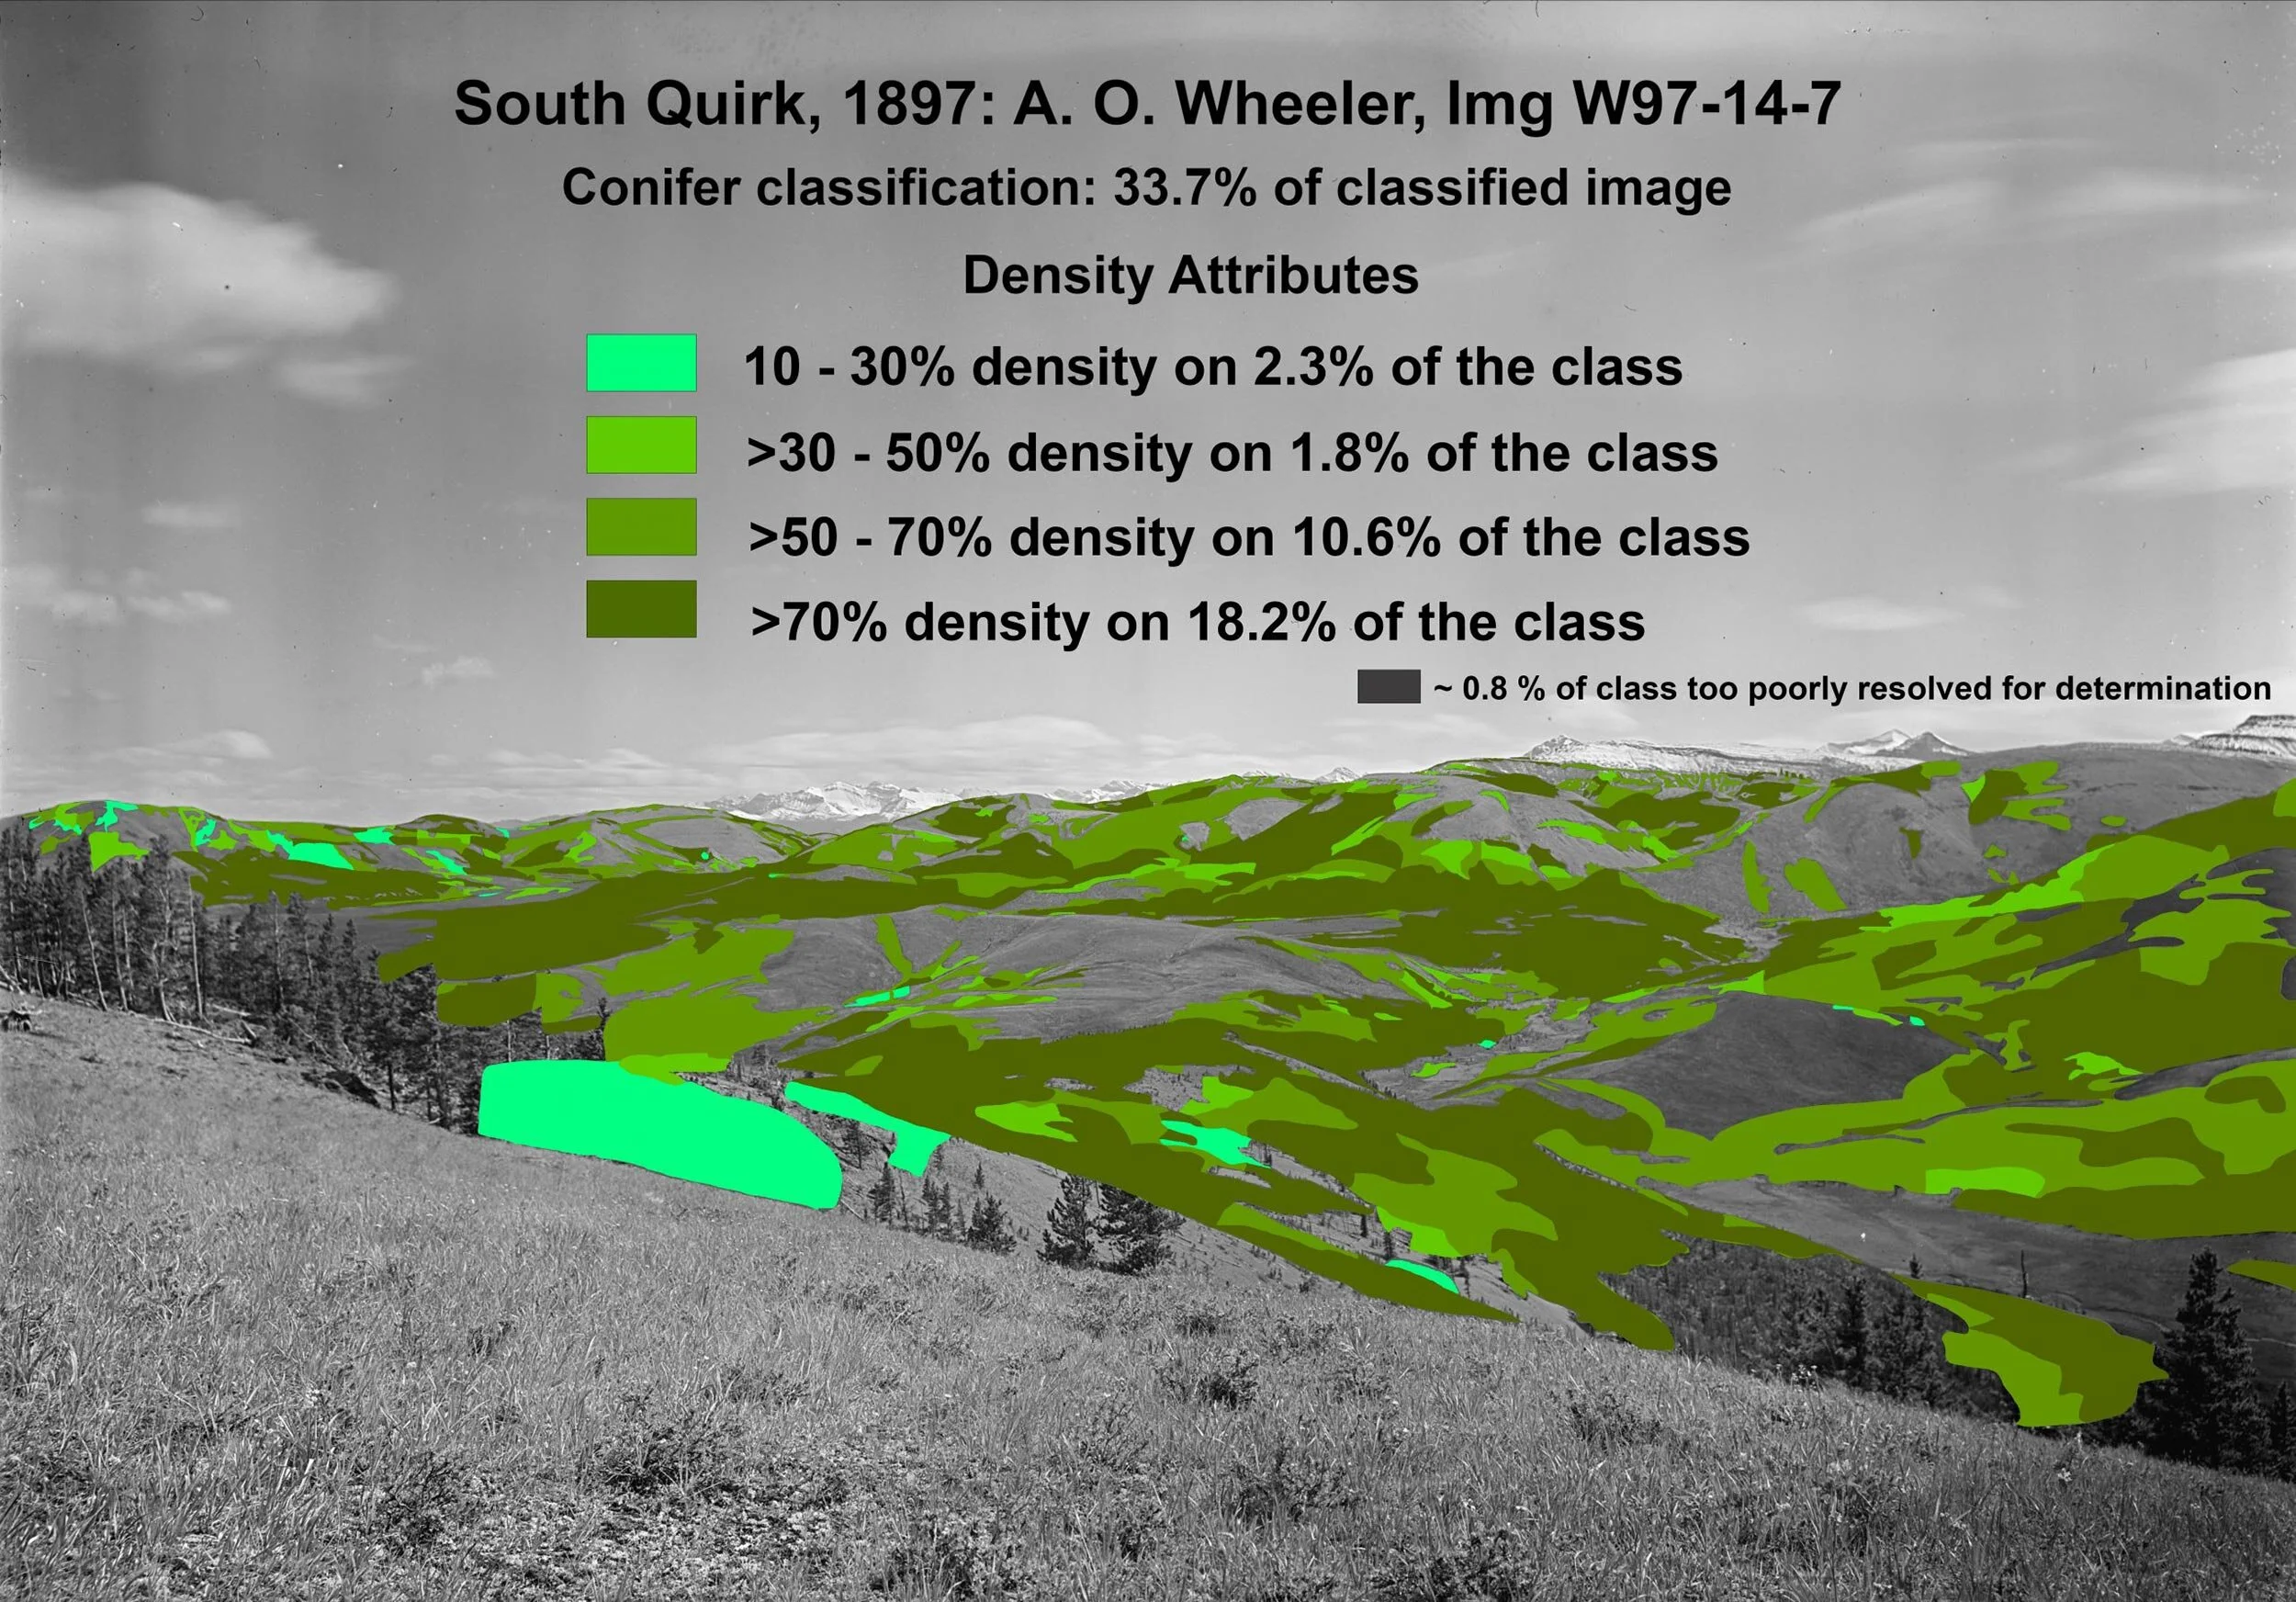

Historical photograph of South Quirk with masks showing conifer tree density classes (green). Each density is expressed as a percentage of the total image, of which the conifer class makes up 33.7%. Image courtesy of the Mountain Legacy Project.
Historical photograph of South Quirk with masks showing conifer tree height classes (pink/purple). Each height class is expressed as a percentage of the total image, of which the conifer class makes up 33.7%. Image courtesy of the Mountain Legacy Project.
From these images, it is evident that coniferous forests replaced grassy meadows over time, and this time the Image Analysis Toolkit has determined exactly where on the landscape this change occurred. These images also reveal that in 1897, nearly half of the coniferous forest on the landscape was at densities lower than 70%. A great deal of these conifer forests were also short (less than four metres), suggesting that they were young and growing back after a disturbance—likely fire.
Taken together, these images analysed using the Image Analysis Toolkit tell a story of a landscape that was patchy and relatively young. As both the Fire Regime and Modelling teams found, this is consistent with the kind of landscape expected to result from a mixed-severity fire regime.
Creating opportunities for new research approaches
The new Image Analysis Toolkit process can be used to help researchers understand how landscapes have changed over time using historical photos and modern repeats. But one very exciting outcome of this new process is how it can now be combined with data collected by the Fire Regime team to help both teams better understand the processes that have shaped these landscapes over time, and how they interacted with each other. This is because fires ultimately destroy some of the evidence of the forest that grew there before—but snapshots of these pre-fire forests exist in historical photographs.
Learn more
How the Mountain Legacy Project collects and analyses repeat photos:
On Top of the World: Another Summer of Repeat Photography from Mountaintops
Repeat Photography in the Field - How does the Oblique Photography team get those photos lined up?
Bringing oblique photography and wildfire research together using viewsheds